 Featured
  Bestseller
  Verified
  New
New  ASP.NET
  Adonis
  Angular
  Astro
Astro  Django
  Express
  Fastify
  Flask
Flask  Flutter
  Free
Free  Go
Go  Ionic
Ionic  Java
Java  JavaScript
  Jetpack Compose
  Kotlin
  Laravel
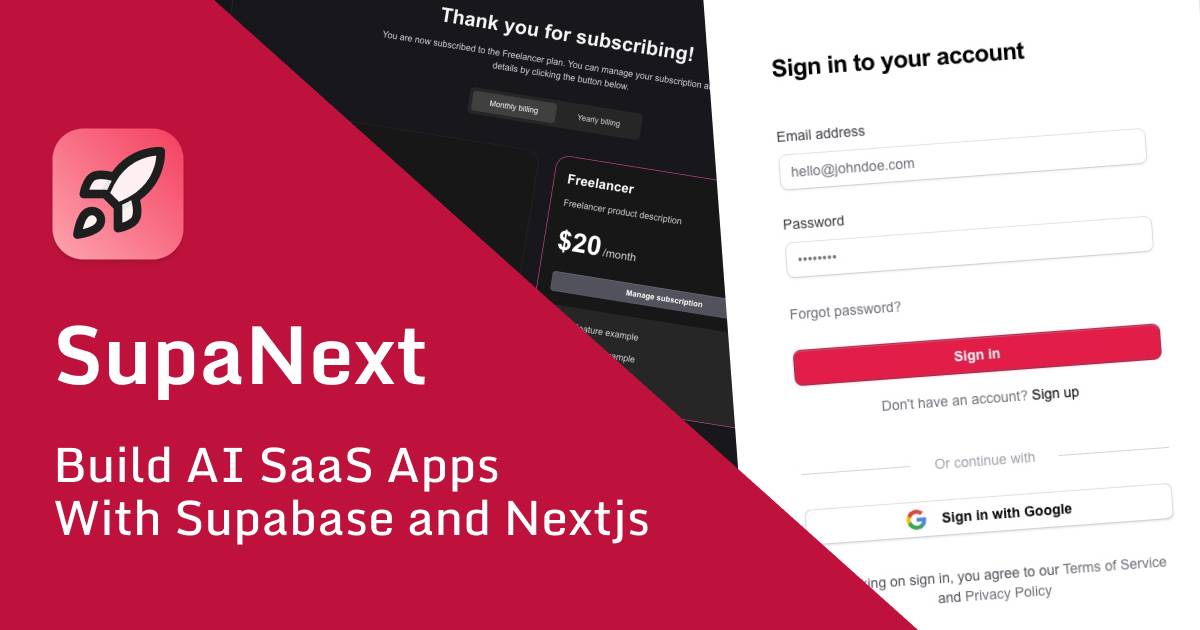
  Next.js
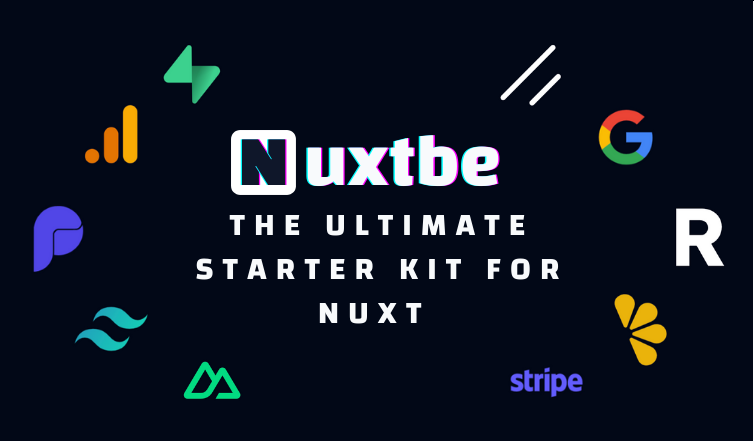
  Nuxt
Nuxt  Phoenix
  Plasmo
  Python
  React
React  React Native
  Remix
Remix  Ruby on Rails
  Rust
Rust  SvelteKit
  Swift
Swift  Symfony
  Wasp
Wasp  2checkout
  BagelPay
  Braintree
  Chargebee
  Creem
Creem  DodoPayments
  LemonSqueezy
  Paddle
  PayPal
  PayU
PayU  Polar
Polar  Stripe
 Top 5 Tools for Bottleneck Detection in SaaS
Learn how to test payment workflows, ensure security, reliability, and compliance in financial operations for SaaS platforms.
Performance bottlenecks like slow page loads or delayed API responses can frustrate users and hurt revenue. Detecting and resolving these issues early is essential. Here are the top 5 tools to help you identify and fix bottlenecks:
- SigNoz: Open-source APM tool with distributed tracing, real-time metrics, and log management. Great for microservices.
- Datadog APM: Cloud-native monitoring with real-time insights and extensive integrations.
- New Relic One: Unified platform offering analytics, tracing, and infrastructure monitoring.
- Dynatrace: AI-powered monitoring for automated issue detection and full-stack visibility.
- AppDynamics: Developer-focused, with transaction tracking and code-level diagnostics.
Quick Comparison
| Tool | Key Features | Best For | Limitations |
|---|---|---|---|
| SigNoz | Tracing, metrics, logs | Cost-effective microservices | Requires setup, limited integrations |
| Datadog | Real-time insights, integrations | Cloud-native environments | Cost transparency, setup effort |
| New Relic | Unified platform, AI insights | Complex distributed systems | Pricing complexity, steep learning curve |
| Dynatrace | AI-driven, automated detection | Dynamic microservices setups | Resource-intensive, premium pricing |
| AppDynamics | Code diagnostics, user monitoring | Transaction-specific bottlenecks | Complex setup, higher resource use |
Choose the tool that matches your team’s size, budget, and technical skillset. Open-source tools like SigNoz are great for startups, while enterprises may benefit from advanced solutions like Dynatrace or AppDynamics.
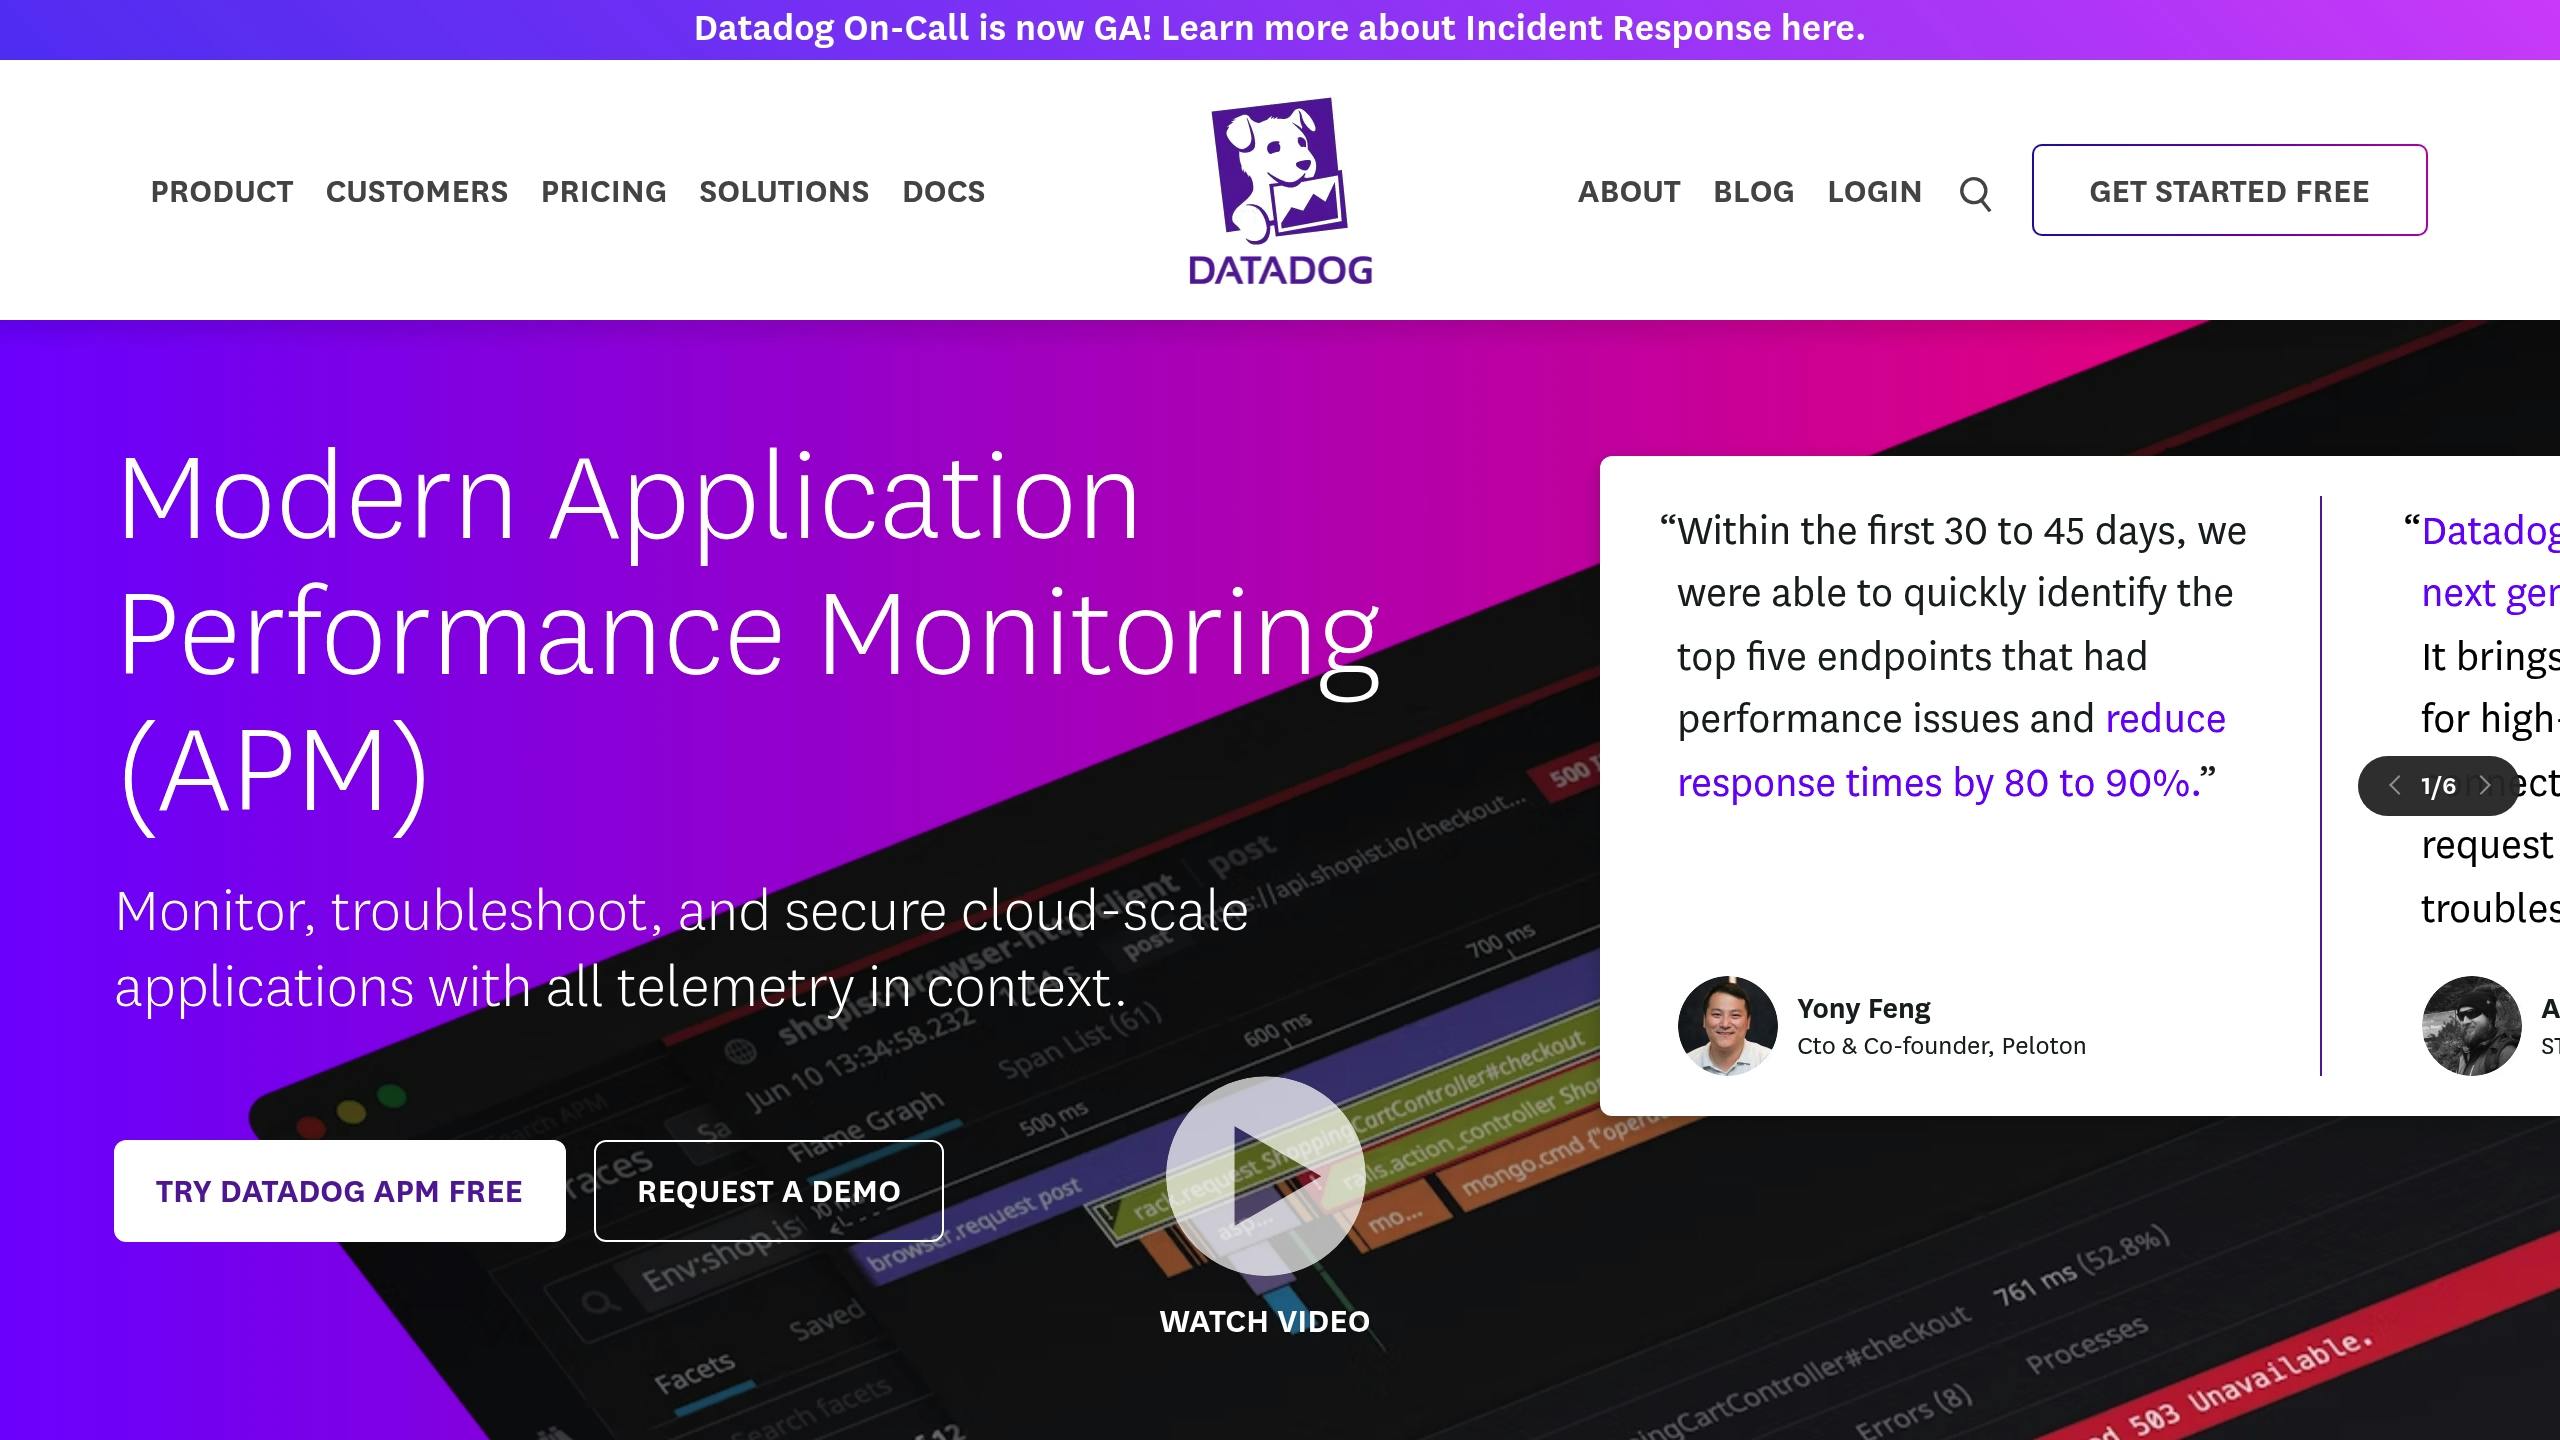
Datadog Application Performance Monitoring (APM)
SigNoz
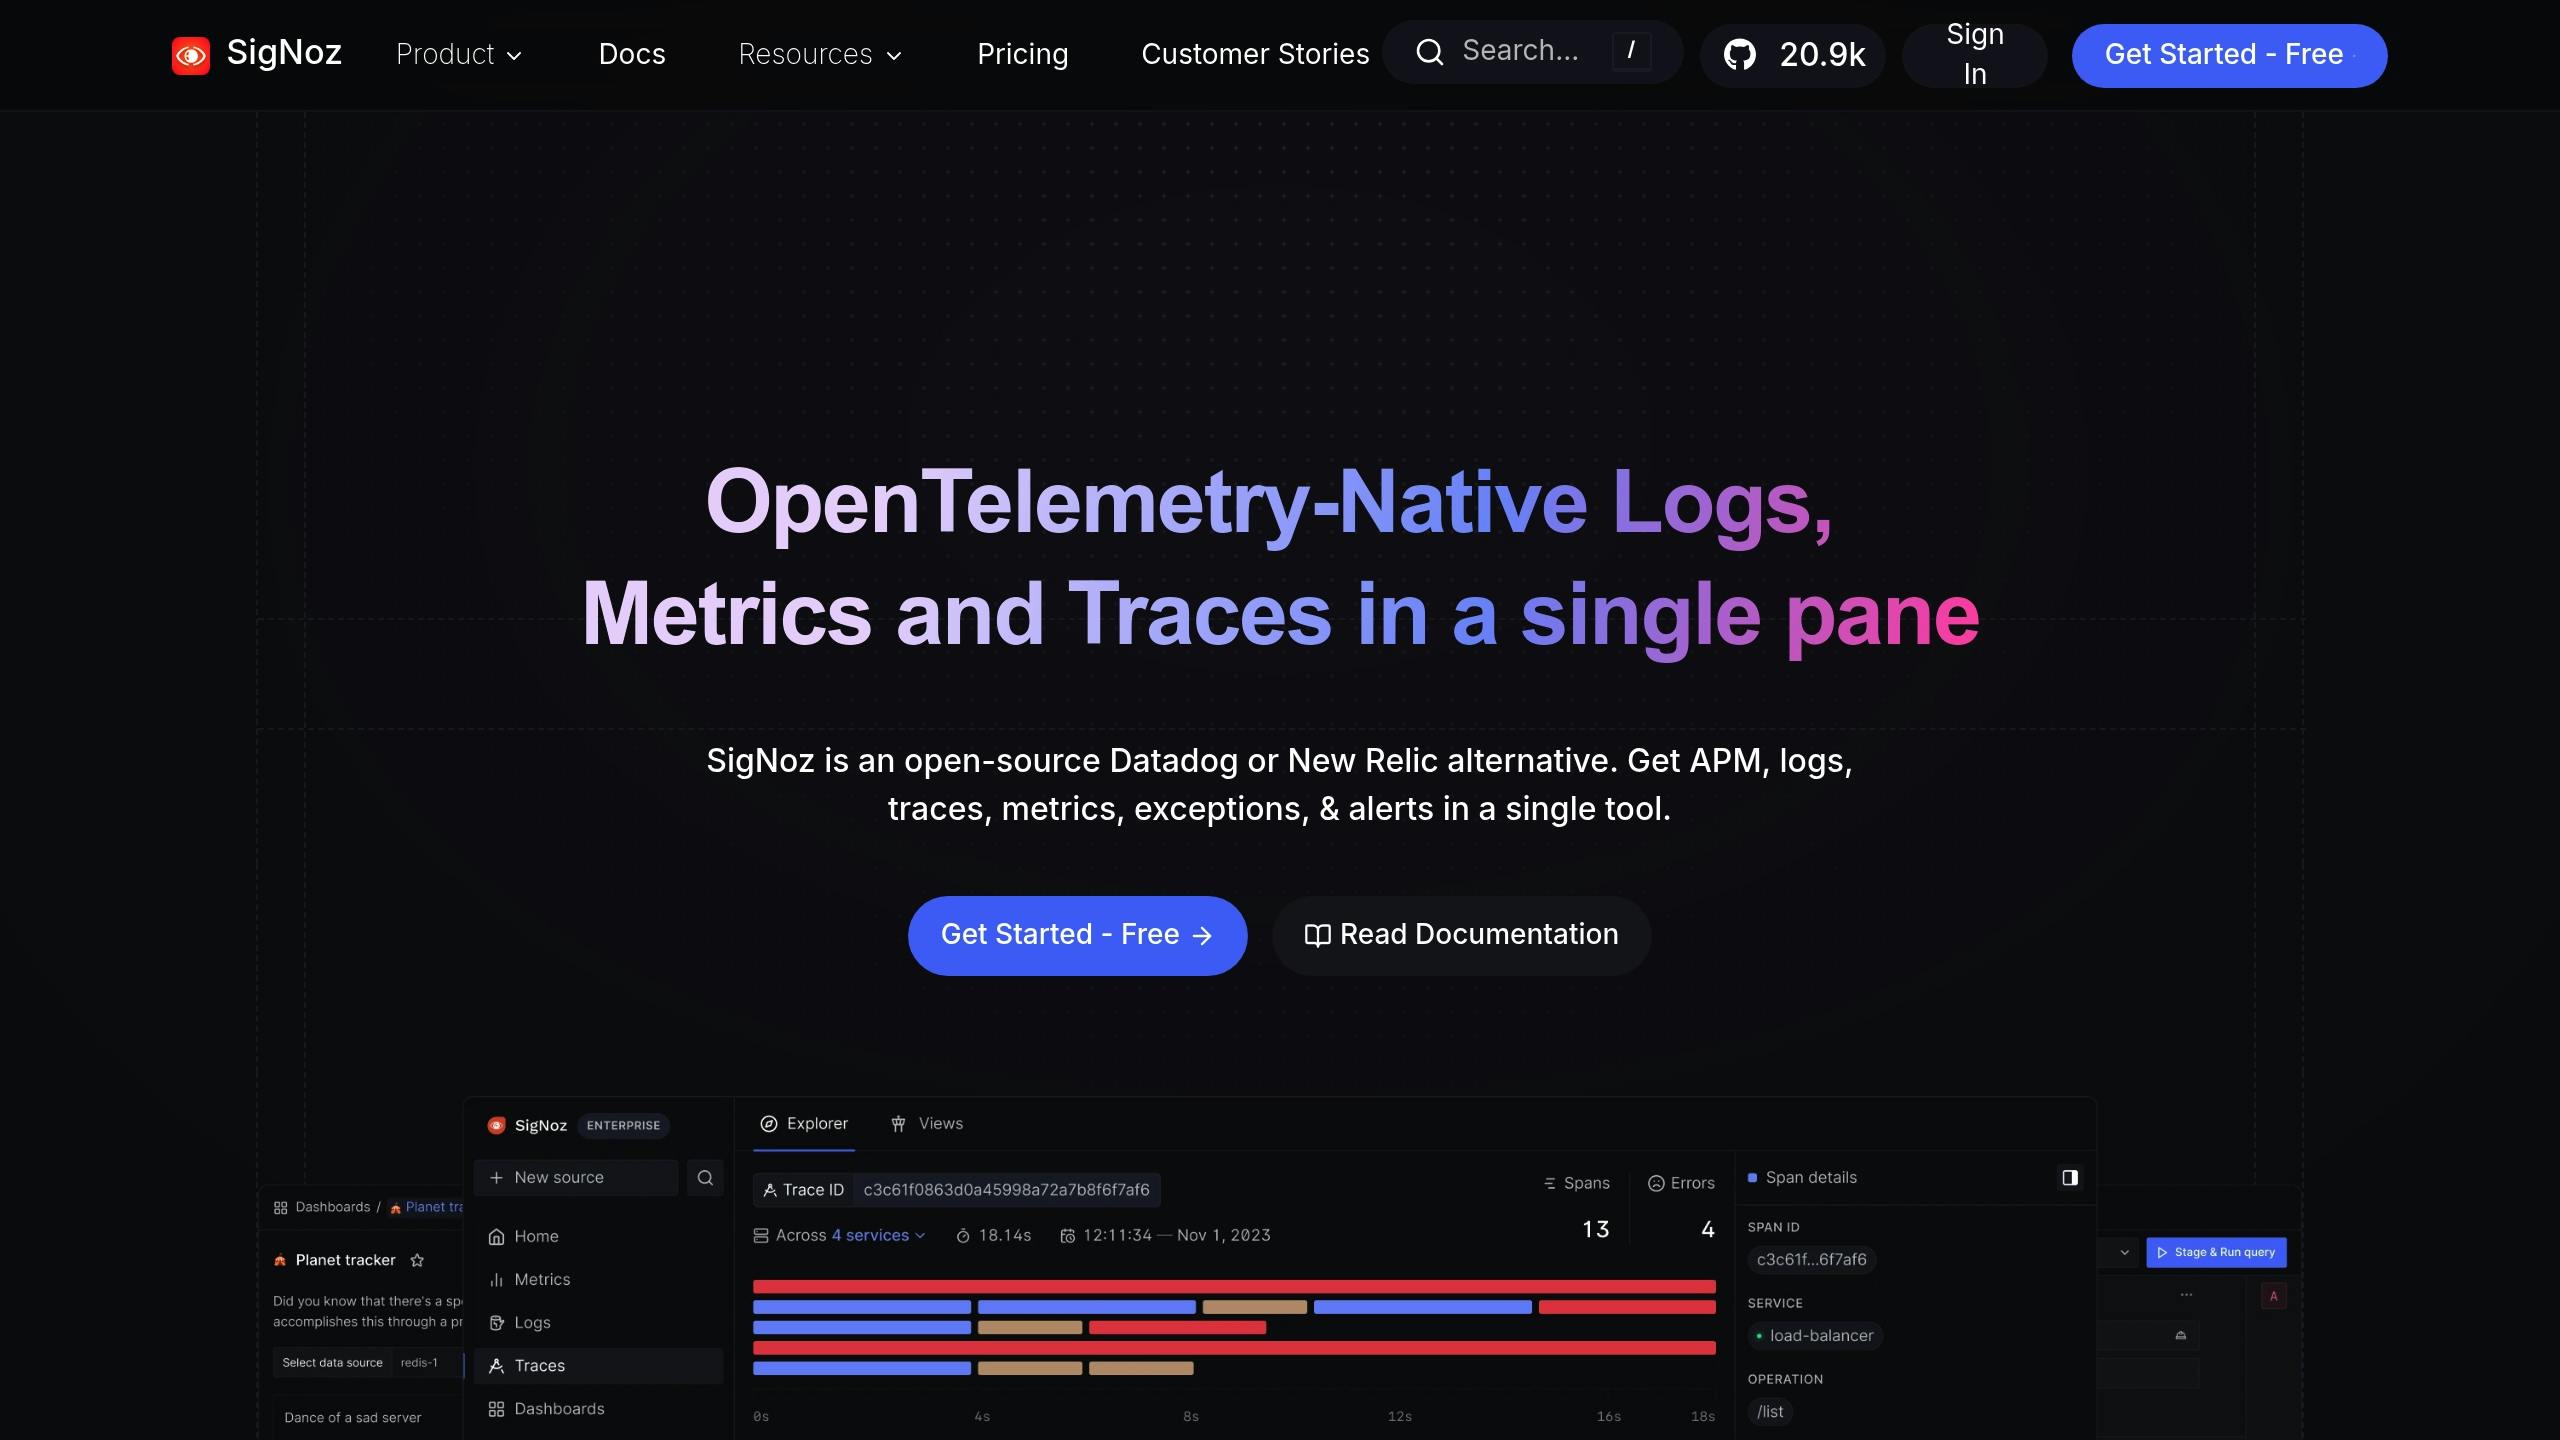
SigNoz is an open-source application performance monitoring (APM) tool designed for modern microservices. It brings together distributed tracing, real-time metrics, and centralized log management to help identify performance issues.
Main Features
SigNoz focuses on three key monitoring areas:
- Distributed Tracing: Tracks requests end-to-end, provides detailed latency insights, and visualizes service dependencies using OpenTelemetry.
- Metrics Monitoring: Collects real-time performance metrics and monitors resource usage like CPU, memory, and network.
- Log Management: Aggregates logs in one place, links them to traces for better context, supports full-text search, and allows custom alerting.
| Feature Category | Capabilities | Use Case |
|---|---|---|
| Tracing | Visualizes request paths | Maps service dependencies |
| Metrics | Tracks resource usage | Detects infrastructure bottlenecks |
| Logging | Analyzes error patterns | Identifies root causes |
Pros and Cons
Pros:
- Full data control with self-hosted deployment
- No vendor lock-in, thanks to OpenTelemetry support
- Scales cost-effectively
- Highly customizable
- Backed by an active community
- Well-suited for complex microservices setups
Cons:
- Requires infrastructure setup and ongoing maintenance
- Has a learning curve for configuration
- Limited built-in integrations
- Relies on internal DevOps expertise
SigNoz is particularly useful for containerized applications, helping detect bottlenecks at both the service and infrastructure levels. It supports multiple programming languages and can be tailored to specific monitoring needs.
Next, we’ll look at Datadog APM, another tool with its own approach to performance monitoring.
Datadog APM
Datadog APM offers real-time insights and error tracking for cloud-native and distributed systems, helping teams identify and address SaaS performance issues efficiently. Here’s a closer look at its features and considerations.
Performance Monitoring Tools
This platform specializes in tracking distributed applications, offering clear visibility into service performance, system dependencies, and areas where bottlenecks might occur within the technology stack.
Pros and Cons
Pros:
- Provides real-time insights into application performance.
- Offers extensive monitoring tools.
- Designed specifically for cloud-native environments.
Cons:
- Limited details about associated costs.
- Integration specifics may require thorough assessment.
- Teams need to evaluate how well it fits their operational requirements.
New Relic One
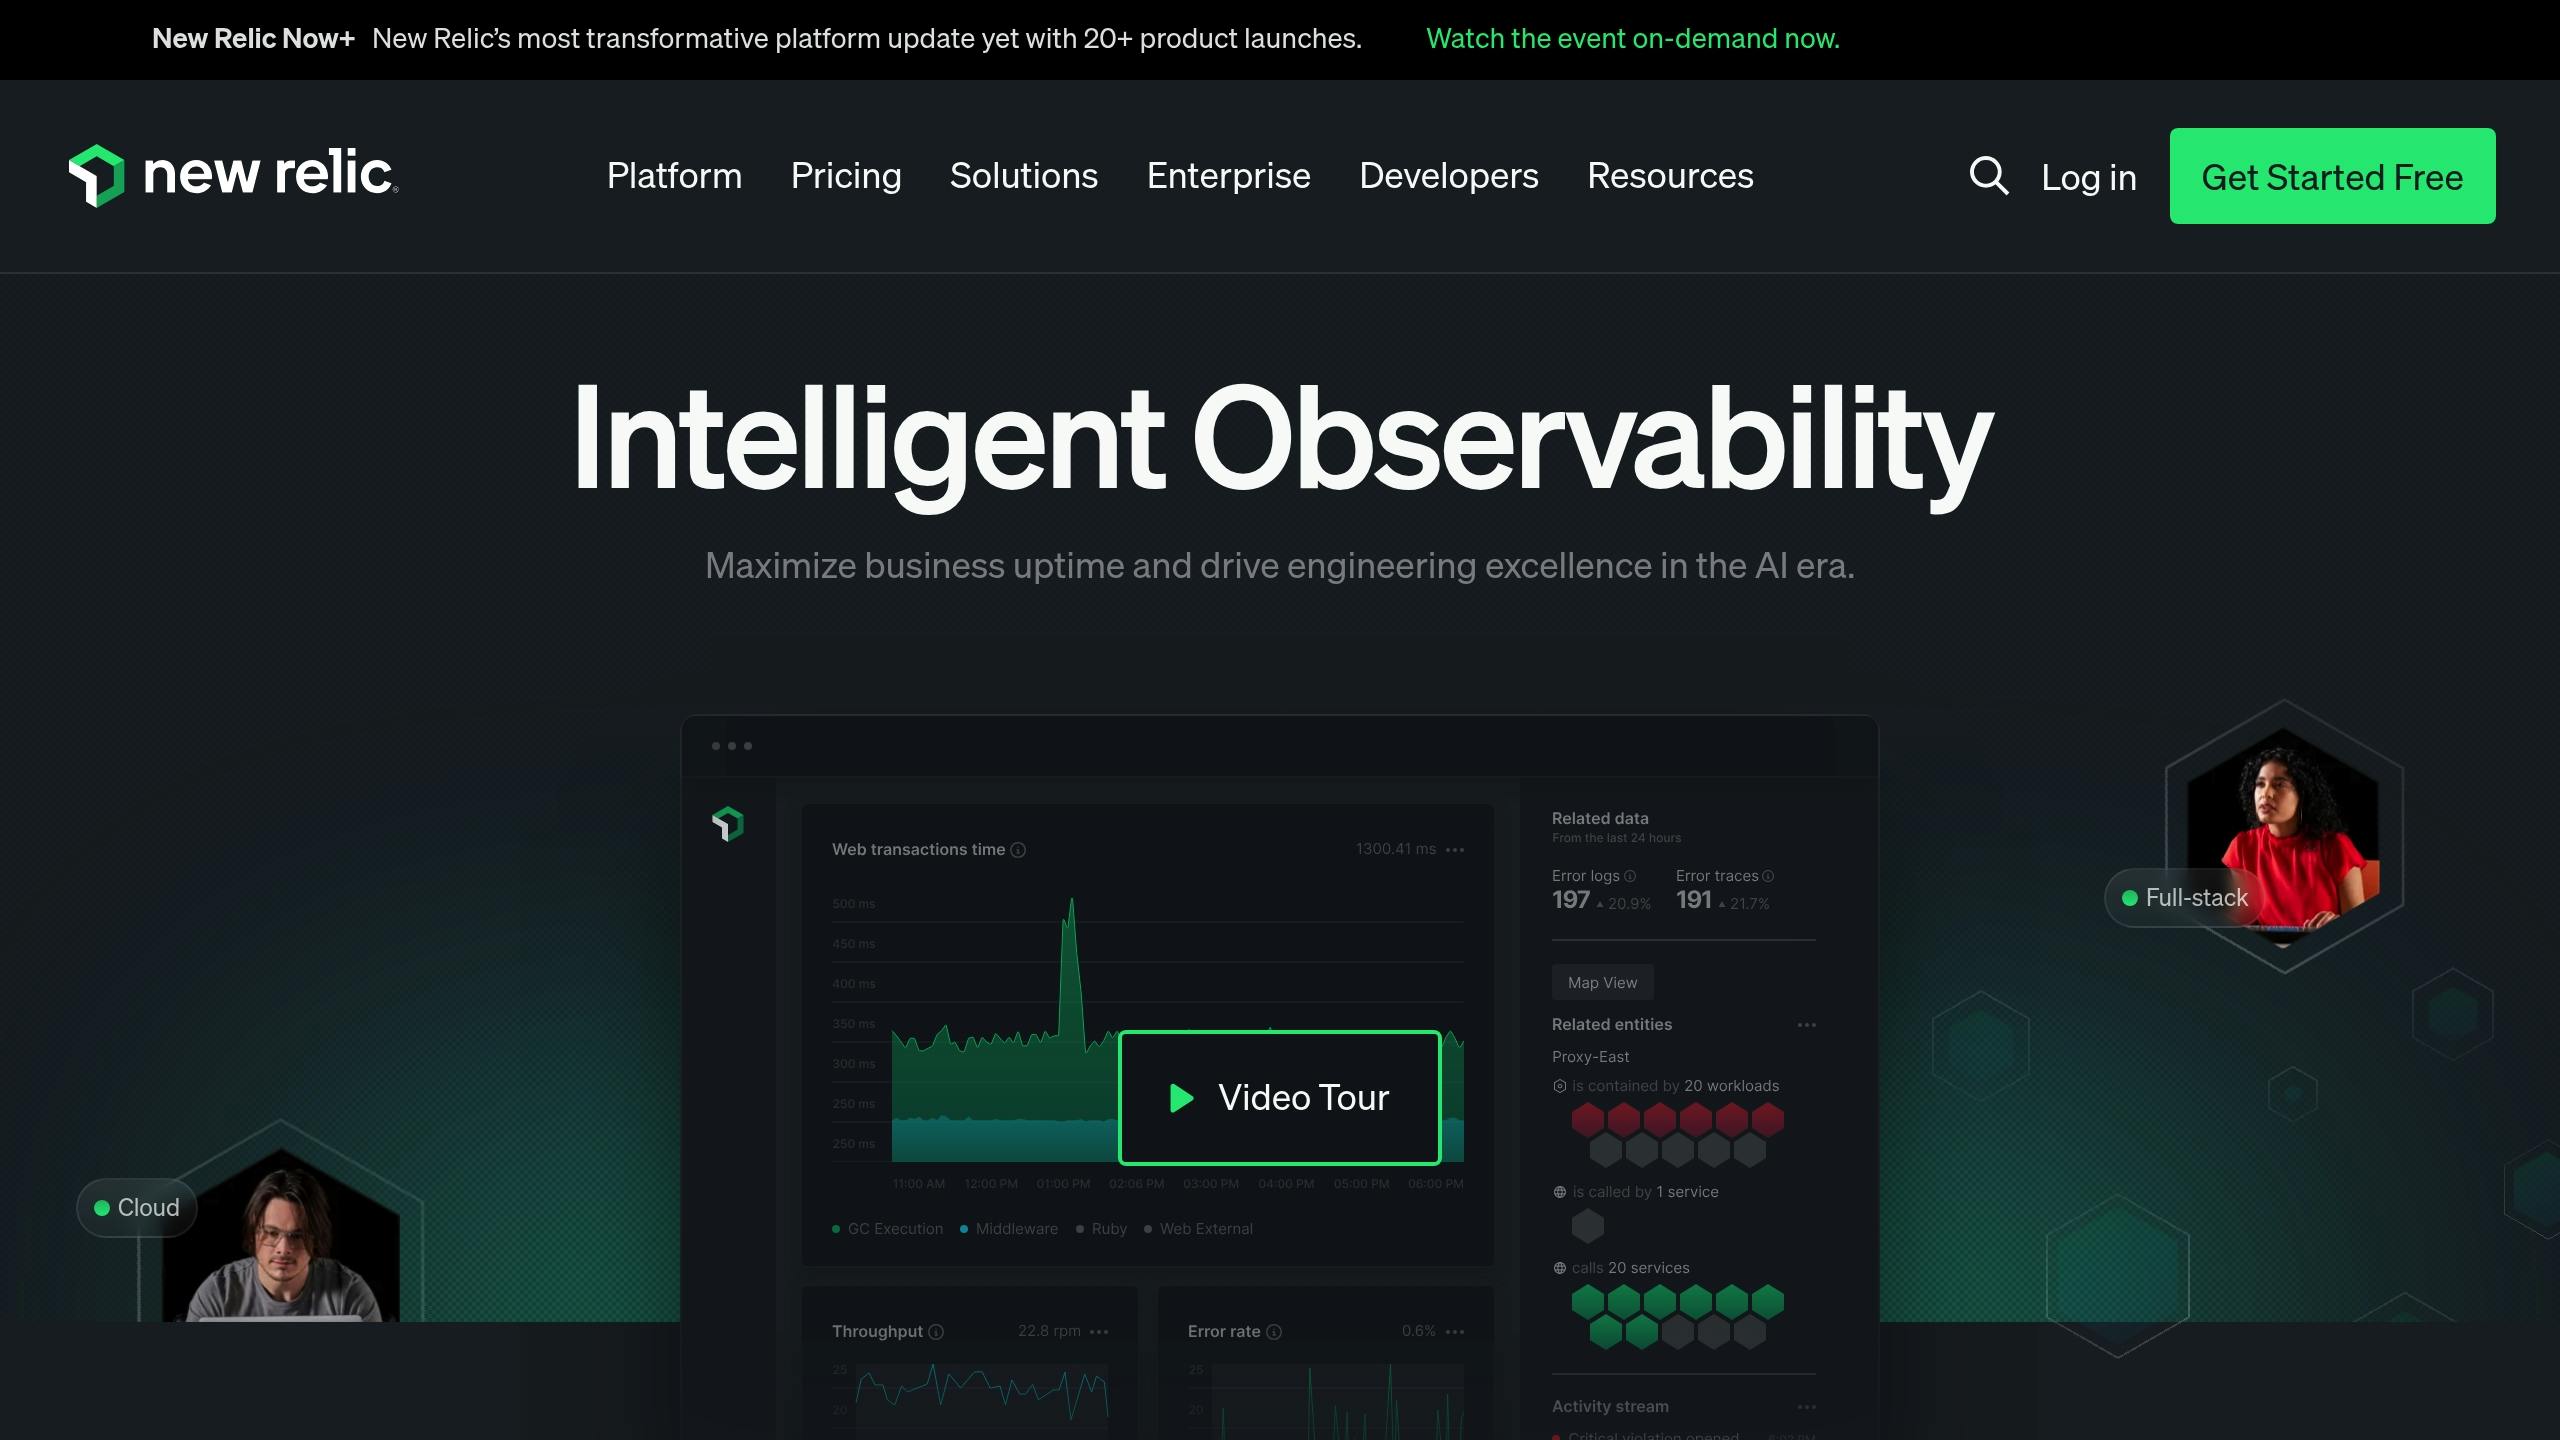
New Relic One builds on tools like Datadog APM, offering a unified platform for identifying performance bottlenecks. It provides an all-in-one solution for monitoring and managing complex, distributed SaaS systems.
Performance Detection Tools
- Real-Time Analytics Engine: Handles large volumes of events efficiently, delivering quick query responses while supporting historical trend analysis.
- Distributed Tracing: Tracks transactions from start to finish, automatically mapping dependencies and breaking down latency.
- Infrastructure Monitoring: Monitors key metrics like CPU, memory, disk usage, and network performance, alongside container and Kubernetes insights.
These tools work together to simplify bottleneck identification, ensuring smoother performance for SaaS applications.
Advantages and Limitations
| Aspect | Advantages | Limitations |
|---|---|---|
| Usability | Intuitive dashboards Custom visualization options Unified platform | Advanced features can be challenging to learn Pricing complexity |
| Performance | Real-time tracking Low overhead Automated anomaly detection | Heavier agent usage Limited offline functionality |
| Integration | Supports many technologies Pre-built integrations Strong API support | Some integrations need extra setup Plugin quality varies |
| Analytics | AI-driven insights Custom query options Predictive analytics | Requires expertise for advanced queries Limited ML customization |
When considering New Relic One, weigh your monitoring needs against your team’s technical skillset and budget.
Dynatrace
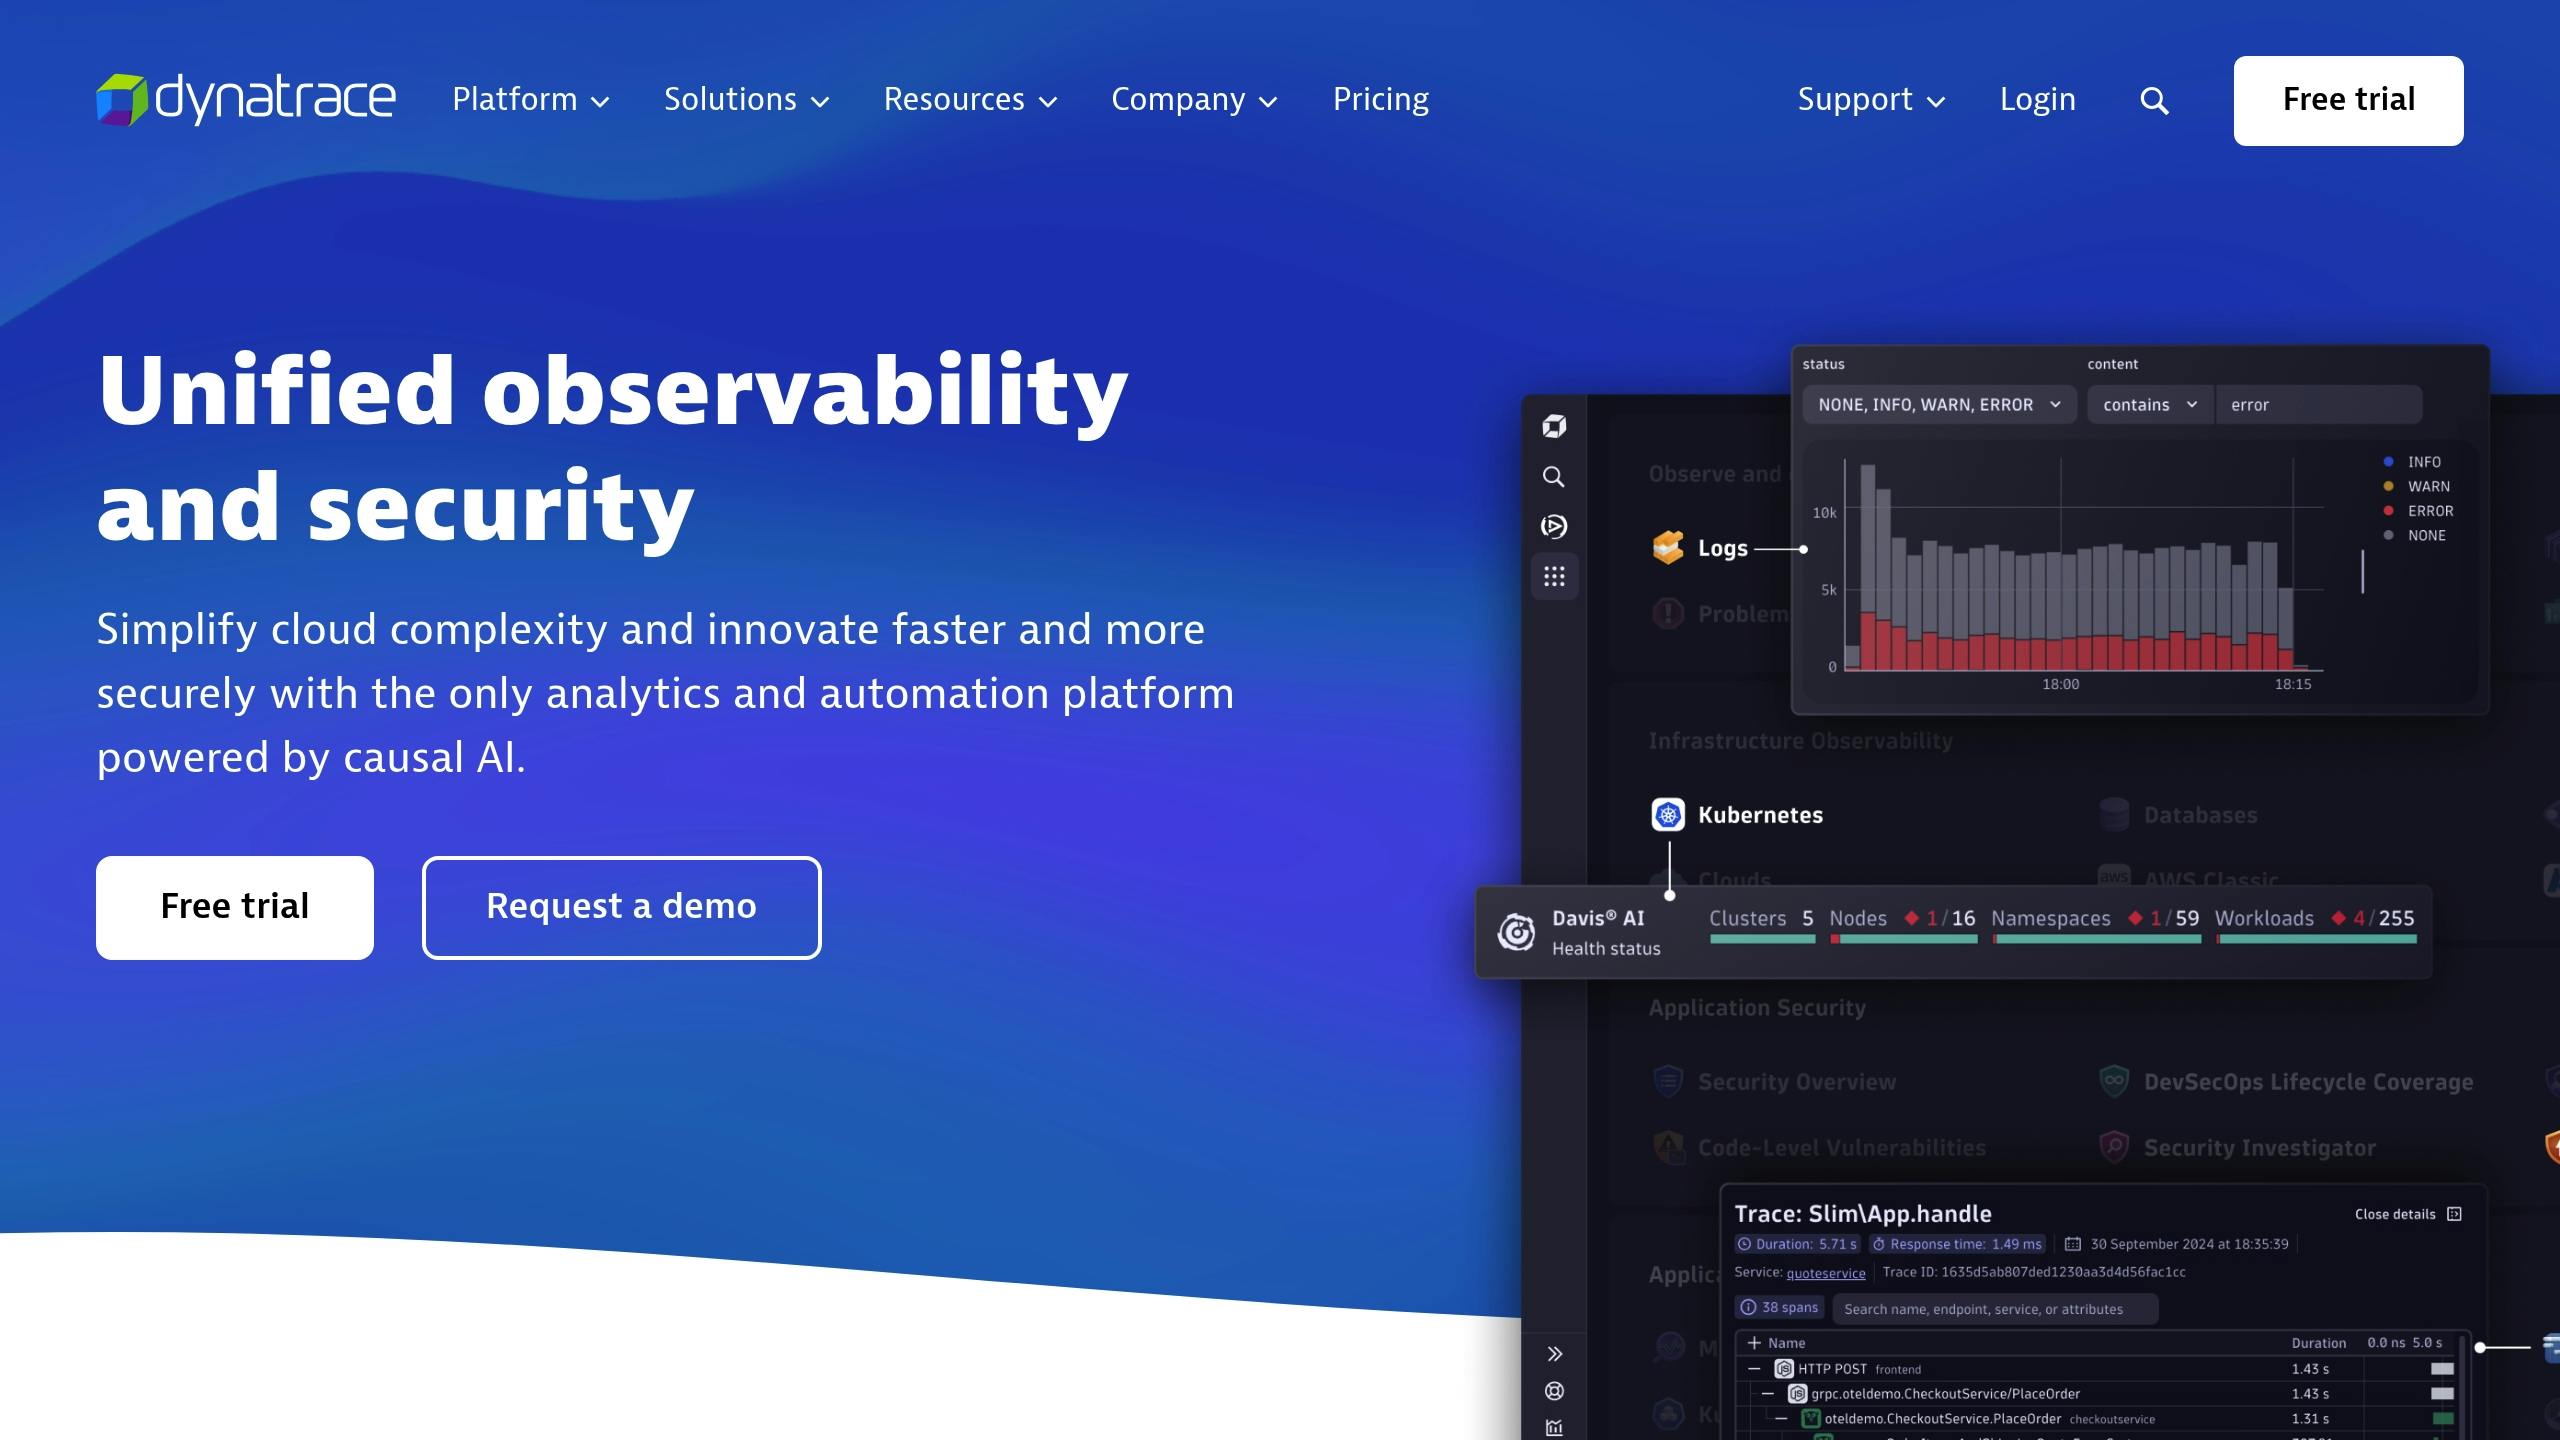
Dynatrace uses AI to identify and fix SaaS performance issues. Its automated problem detection stands out compared to traditional monitoring tools.
AI Monitoring System
Dynatrace’s AI-powered monitoring system includes these key features:
- Automatically maps application architecture to uncover dependencies and potential weak points.
- Leverages the Davis AI engine to spot anomalies and analyze events before they affect users.
- Quickly identifies performance issues, including at the code level, to reduce downtime and monitor user experience.
Pros and Cons
| Category | Pros | Cons |
|---|---|---|
| AI Capabilities | Automated root cause detection; Predictive analytics; Real-time topology mapping | Requires an initial setup period |
| Monitoring Coverage | Full-stack visibility; Auto-instrumentation; Cloud-native support | Can use more resources; Limited support for older systems |
| Cost Efficiency | Automation reduces operational workload | Premium pricing may apply |
| Scalability | Handles dynamic scaling; Multi-cloud support; Enterprise-grade security | Resource-intensive; Has a learning curve |
Dynatrace excels in managing complex microservices architectures, where manual monitoring often falls short. Its ability to automatically adjust to infrastructure changes provides critical insights for dynamic SaaS setups. However, a detailed setup process is necessary to make the most of these features.
For those interested in complementary tools, AppDynamics offers developer-focused solutions for monitoring and optimization.
AppDynamics
AppDynamics provides in-depth transaction tracking and code-level diagnostics, making it a go-to solution for monitoring complex distributed systems.
Developer Tools
| Feature | Capability | Impact |
|---|---|---|
| Business Transaction Monitoring | Tracks user interactions across microservices | Pinpoints transaction-specific bottlenecks |
| Code Profiling | Real-time stack trace analysis | Identifies exact methods causing slowdowns |
| Infrastructure Correlation | Maps application dependencies | Highlights how infrastructure affects performance |
| User Session Monitoring | Records and replays user interactions | Helps reproduce issues for faster debugging |
AppDynamics connects technical performance metrics to business outcomes, visualizing user paths to help teams focus on fixes that matter most to revenue. These tools form the backbone of its monitoring capabilities, offering both strengths and challenges.
Advantages and Limitations
AppDynamics brings a mix of benefits and challenges to the table:
Strengths:
- Provides detailed code-level insights without adding much overhead.
- Automatically detects baselines and sends alerts for anomalies.
- Works seamlessly with major cloud platforms like AWS, Azure, and GCP.
- Offers customizable dashboards for different team needs.
Limitations:
- The setup process can be complex and time-consuming.
- Uses more resources in larger deployments.
- Advanced features require a steeper learning curve.
- Premium pricing may not be ideal for smaller businesses.
Its Dynamic Baseline Engine adjusts thresholds based on historical data to minimize false alerts, while its container monitoring tools offer detailed insights into Kubernetes and Docker environments.
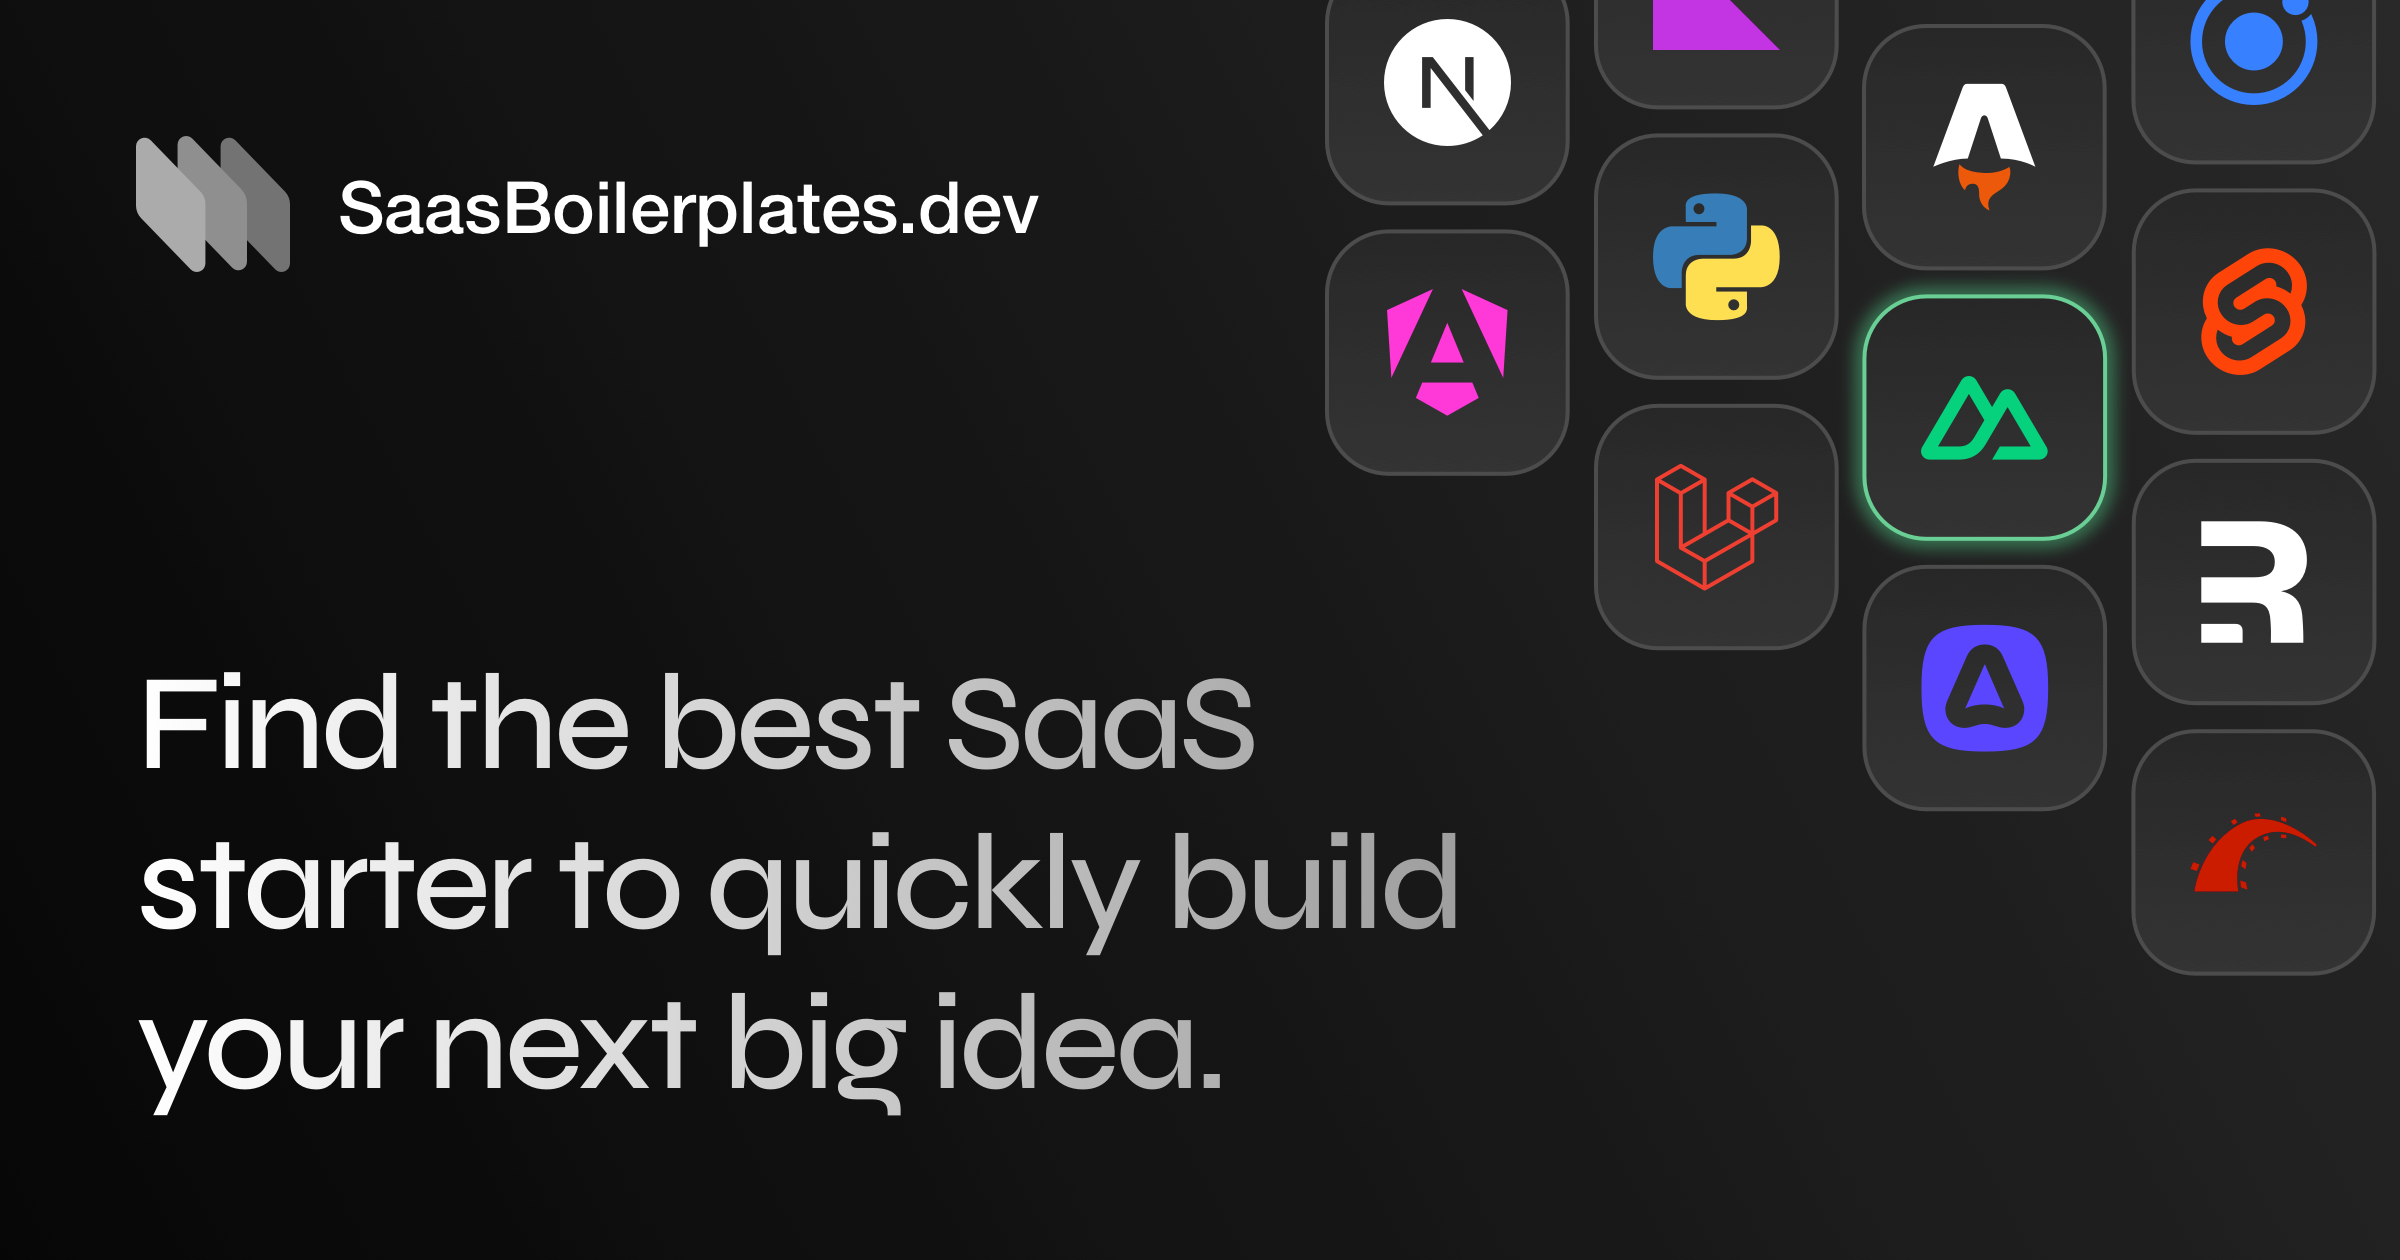
Best SaaS Boilerplates Integration
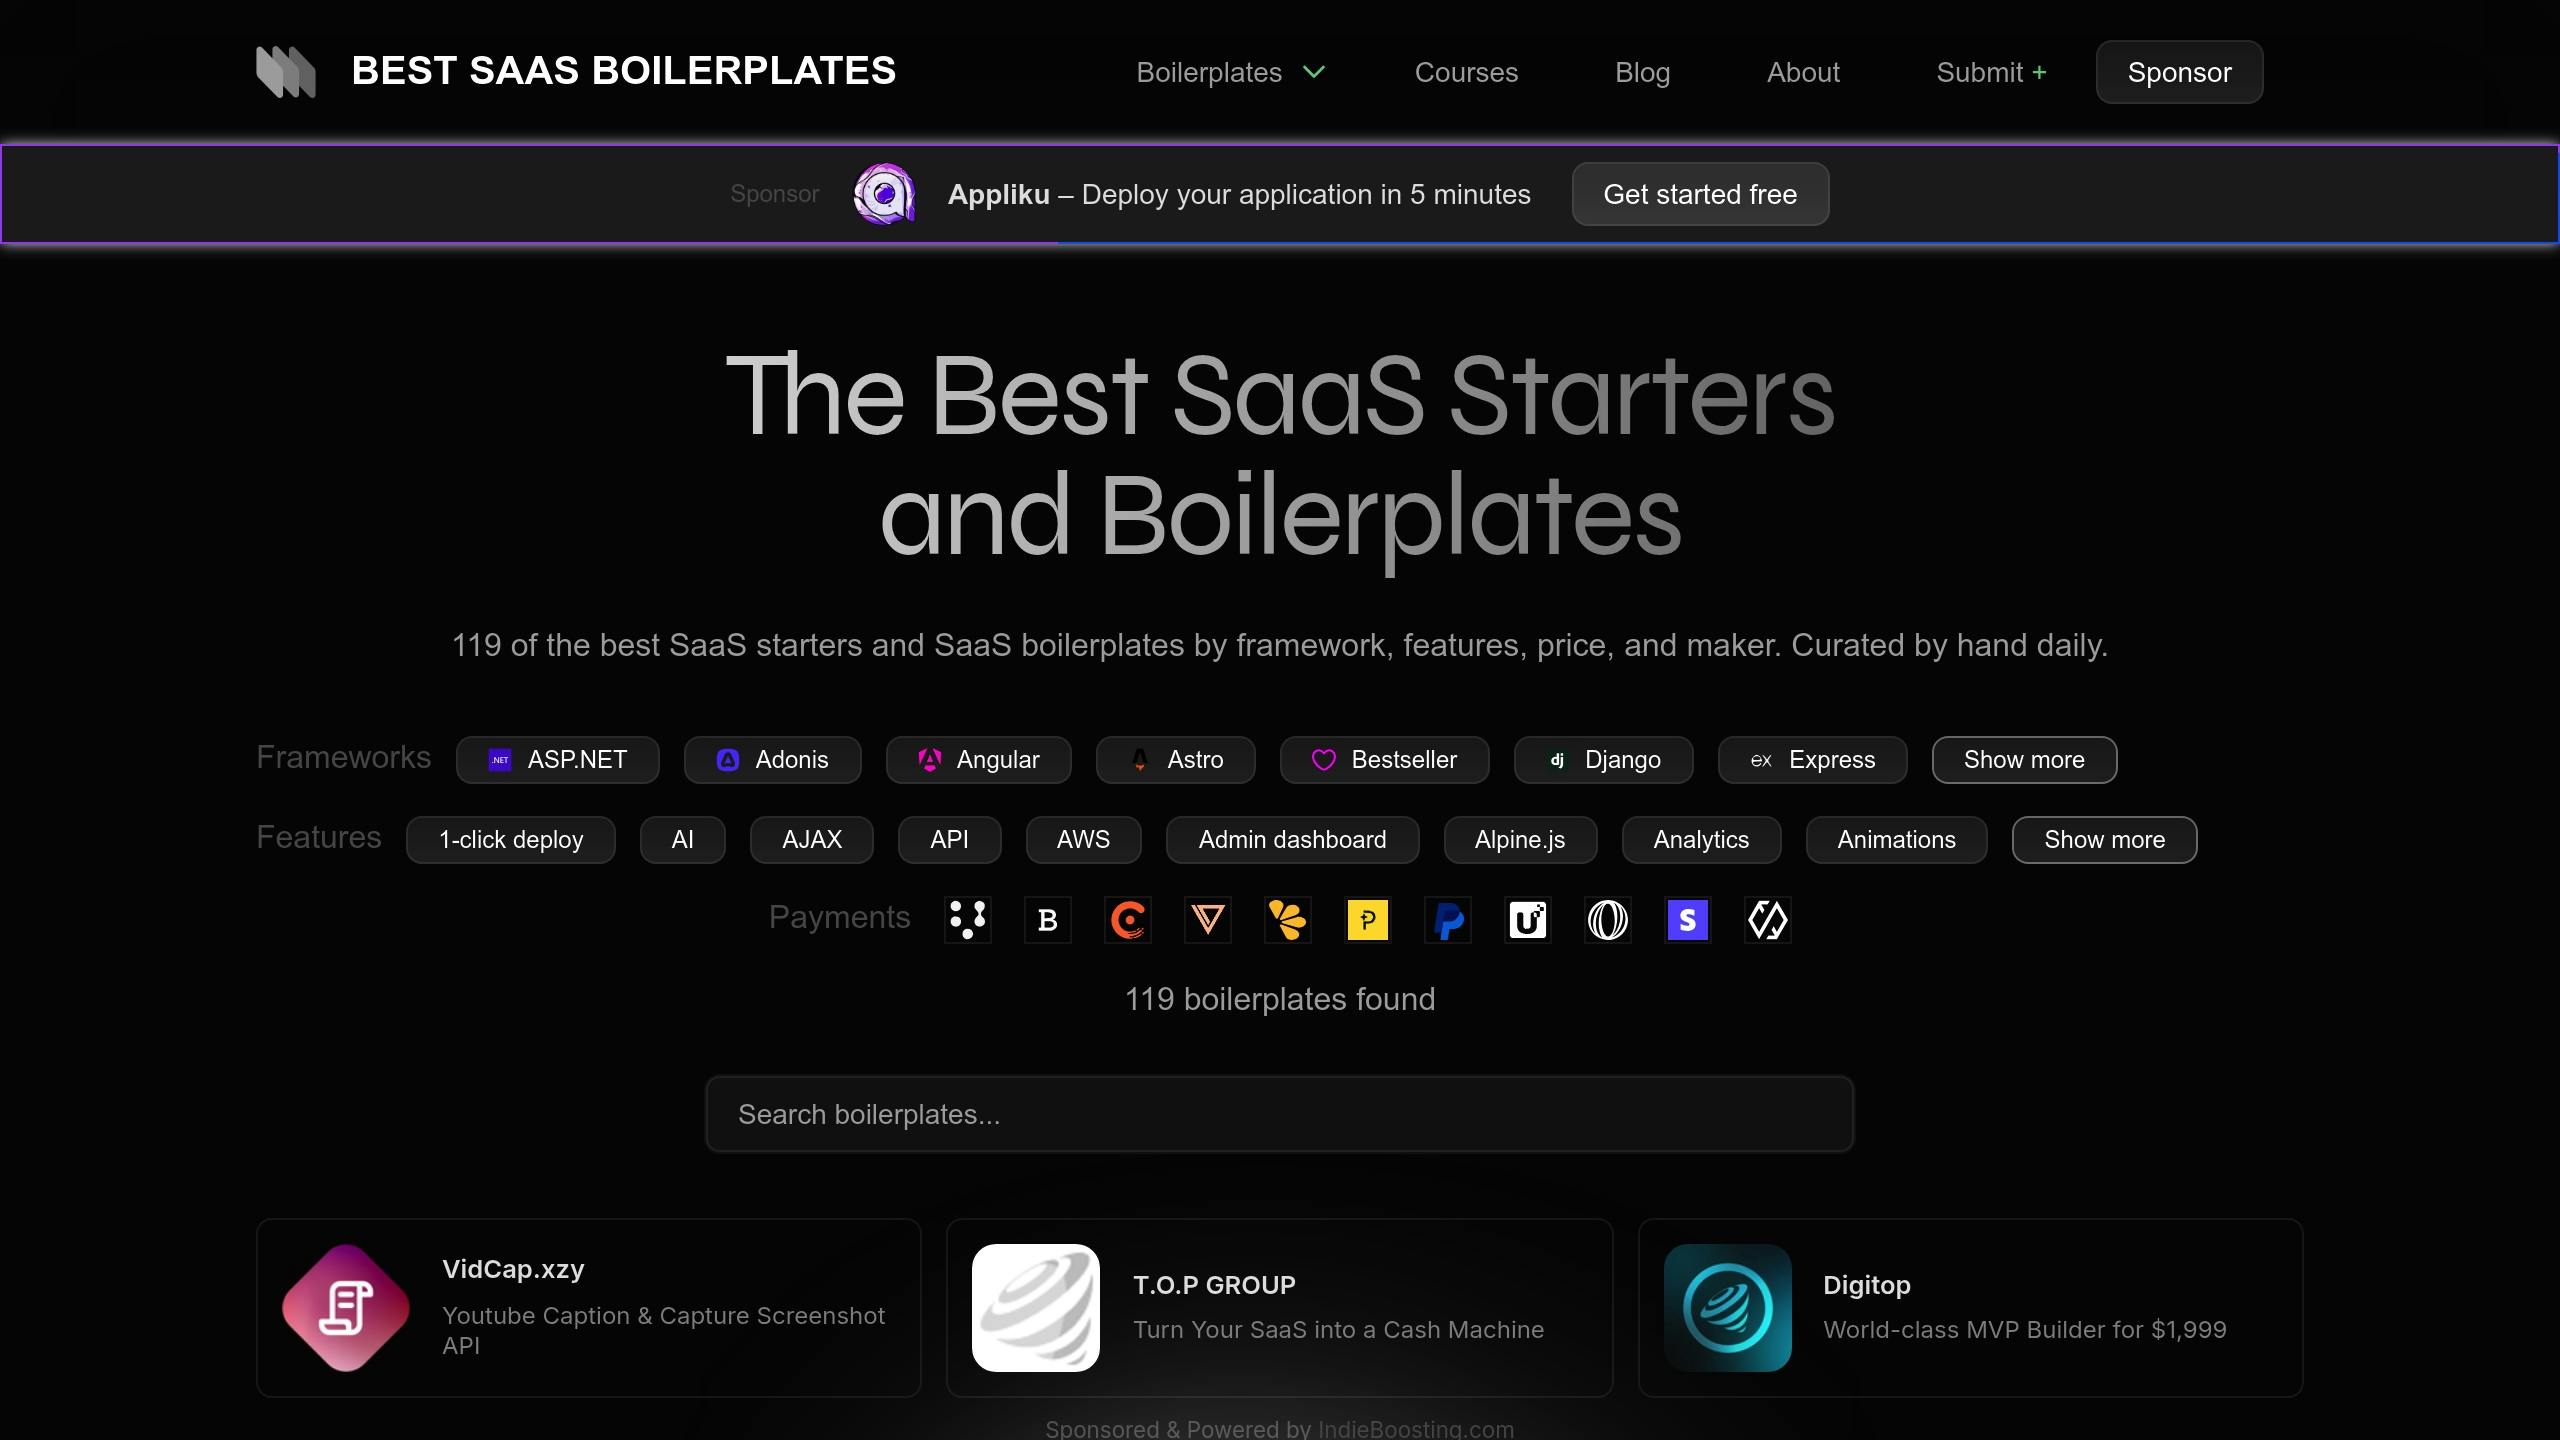
Integrating advanced monitoring tools with ready-to-use boilerplates can greatly improve SaaS performance. Best SaaS Boilerplates provides pre-configured templates that make integration simpler. With a collection of over 119 SaaS starters, these templates offer an excellent starting point for seamless integration.
Platform Features
Best SaaS Boilerplates includes components designed to work hand-in-hand with bottleneck detection tools:
| Feature Category | Integration Efficiency | Impact on Monitoring |
|---|---|---|
| Admin Dashboards | Interfaces for metrics visualization | Speeds up deployment of monitoring dashboards |
| API Integrations | Pre-built connectors for monitoring tools | Cuts down setup time for performance tracking |
| Multi-tenancy Support | Isolated monitoring for each tenant | Eases per-client performance analysis |
| Authentication Systems | Standardized user tracking | Improves monitoring of user sessions |
These features not only simplify setup but also enhance performance when paired with tools like Datadog APM and New Relic One. The platform also includes an advanced filtering system to help developers choose boilerplates that align with their preferred monitoring tools.
Performance Benefits
The templates from Best SaaS Boilerplates are designed to reduce bottlenecks and improve efficiency. Here’s how:
- Infrastructure Optimization: Pre-configured deployment settings and CI/CD integration ensure consistent performance monitoring throughout development.
- Analytics Integration: Many templates include built-in analytics hooks, allowing for easy implementation of performance tracking without extra setup.
- Scalability Features: Multi-tenancy support ensures efficient monitoring and resource management across different customer groups.
”When it came time to start building my new SaaS, a friend pointed me to Best SaaS Boilerplates. It had absolutely everything I needed, and saved me hours hunting down boilerplates on Twitter, HackerNews and ProductHunt.”
– Lesley Sim, Founder of Newsletter Glue
The platform offers a range of templates, from free options to premium solutions costing up to $2,999. Each template is carefully curated to ensure it works well with modern monitoring tools and follows best practices for performance optimization.
Conclusion
Choose bottleneck detection tools that align with your team’s specific needs and budget. If you’re looking for cost-effective options, open-source tools like SigNoz offer solid capabilities without breaking the bank. For companies managing more complex infrastructures, tools like Dynatrace or AppDynamics provide advanced monitoring features.
Using pre-built solutions can save time and effort. Incorporating boilerplates into your setup makes monitoring implementation quicker and easier.
Here’s a simple framework to help you decide which approach fits your requirements:
| Company Size | Budget Range | Recommended Approach |
|---|---|---|
| Startups (1–10 devs) | $0–$500/month | Free boilerplate + open-source monitoring |
| SMBs (10–50 devs) | $500–$2,000/month | Premium boilerplate + mid-tier APM |
| Enterprise (50+ devs) | $2,000+/month | Custom solution + enterprise monitoring |
This table provides clear guidance for teams of all sizes.
Recommended SaaS boilerplates
The developer community highly endorses the following SaaS boilerplates for their performance and ease of use: