How to Identify SaaS Scalability Issues
Learn to identify and address SaaS scalability issues with key metrics, monitoring tools, and effective testing methods to optimize performance.
SaaS scalability issues can cost you customers, revenue, and performance. Here’s how to spot and address them early:
- Key Metrics to Watch: Track response times, system resource usage (CPU, memory), and error rates to detect bottlenecks.
- Common Bottlenecks: Watch for database issues (slow queries, connection limits), unoptimized code (memory leaks, inefficiencies), and external dependencies (API limits, latency).
- Use Monitoring Tools: Tools like New Relic, Datadog, and the ELK Stack help track system health and pinpoint issues.
- Testing & Planning: Perform load and stress testing to understand system limits and plan resources for growth.
- Pre-Built Solutions: SaaS boilerplates like Makerkit and Shipped simplify development with scalable frameworks.
To ensure your SaaS app scales effectively, focus on proactive monitoring, testing, and using tools or frameworks designed for growth.
System Design: Scale System From Zero To Million Users
Key Performance Metrics
Understanding how your business performs starts with tracking key metrics. By keeping an eye on response times, resource usage, and error rates, you can pinpoint issues that may limit scalability.
Response Times
Response times show how quickly your application handles user requests. Faster responses lead to a better user experience, while delays might hint at performance problems. Keep tabs on response times for APIs, database queries, external services, authentication processes, and payment systems to catch any slowdowns.
System Resource Usage
Monitoring system resources - like CPU, memory, disk I/O, and network bandwidth - helps you spot inefficiencies or resource overloads before they impact users. By analyzing patterns, you can identify when resources are nearing their limits and address bottlenecks proactively.
Error Rate Analysis
Error rates reveal how stable your application is. Look at data like HTTP errors, database timeouts, and failed API calls to uncover potential weaknesses. A spike in errors often signals system stress. Set up automated alerts to respond quickly when issues arise. Using these metrics with monitoring tools ensures you can continuously identify and fix performance problems as they occur.
Monitoring Tools
Monitoring tools help identify SaaS scalability challenges before they affect users by providing a clear picture of system health and performance. These tools build on previously discussed metrics, offering actionable data for real-time improvements.
Performance Monitoring Tools
New Relic and Datadog are two leading application performance monitoring (APM) tools for tracking system behavior.
- New Relic: Its distributed tracing feature pinpoints bottlenecks in microservices architectures.
- Datadog: Offers a metrics dashboard to detect performance irregularities.
These tools allow you to:
- Trace user requests as they move through backend services.
- Keep tabs on CPU, memory, and network usage across cloud environments.
- Set up automatic alerts for breached performance thresholds.
- Visualize how different parts of your application interact.
Log Management Systems
Centralized log management is crucial for spotting patterns and diagnosing issues. The ELK Stack (Elasticsearch, Logstash, Kibana) is a popular choice, offering:
- A unified location for logs from multiple services and servers.
- Tools to detect recurring errors or issues.
- Quick access to historical log data.
- Custom dashboards for tracking key metrics.
Other options, like Splunk and Graylog, provide similar features for log analysis and management.
Database Performance Tools
Monitoring your database is essential for maintaining SaaS performance. Here are some tools and their ideal applications:
| Tool | Features | Best For |
|---|---|---|
| AWS RDS Performance Insights | Monitors real-time database load, analyzes SQL queries | Databases hosted on AWS |
| Percona Monitoring and Management | Open-source solution with query analytics | Self-hosted databases |
| SolarWinds Database Performance Analyzer | Tracks database performance across platforms, analyzes wait times | Enterprise-level environments |
These tools help identify slow queries, connection problems, and resource limitations that might hinder scalability. Regular database monitoring ensures you can address issues before they disrupt your users.
Common Performance Bottlenecks
Identifying these bottlenecks goes hand in hand with tracking and monitoring metrics to ensure your system can scale effectively.
Database Issues
These are some of the most frequent database-related problems:
- N+1 Query Problems: Running multiple sequential queries instead of using optimized joins or bulk operations.
- Inefficient Indexing: Poor indexing slows down query execution times.
- Connection Pool Saturation: Exhausting available database connections, leading to delays or failures.
Code Performance
Poorly written or unoptimized code can create serious performance issues:
- Memory Leaks: Gradual resource depletion over time.
- Inefficient Algorithms: Slows down processes and increases resource usage.
- CPU-Intensive Tasks: Tasks that block execution, affecting overall performance.
To improve code performance, you can:
- Use tools like the Node.js profiler or Chrome DevTools to identify bottlenecks.
- Cache frequently accessed data to reduce redundant operations.
- Leverage asynchronous operations to avoid blocking the main thread.
- Explore pre-built SaaS boilerplates for efficient, optimized code structures.
External Dependencies
Sometimes, the issues aren’t within your system but are caused by external services:
- API Rate Limits: Hitting usage quotas during high-demand periods.
- Network Latency: Delays caused by slow responses from third-party services.
- Service Outages: Downtime in external services affecting your application.
To reduce the impact of these external factors:
- Use circuit breakers to gracefully handle service failures.
- Cache responses from external APIs whenever possible.
- Set up fallback mechanisms to ensure critical functions remain operational.
Testing Methods
Systematically evaluating your SaaS application’s scalability is crucial. By using proven testing methods, you can identify performance issues and bottlenecks before they affect your users.
Load Testing Steps
- Define realistic scenarios: Base your tests on typical user behavior to ensure accuracy.
- Replicate your production environment: Match server settings, database structure, data volume, and network conditions to your live setup.
- Run incremental tests: Gradually increase the number of simultaneous users while monitoring key metrics like response times, error rates, resource usage, and throughput. This helps pinpoint when performance starts to degrade.
Once routine performance is verified, stress testing can uncover your system’s limits.
Stress Testing Process
- Resource monitoring: Observe how the system handles extreme loads by tracking CPU usage, memory, network bandwidth, and database connections.
- Breaking point analysis: Identify when performance starts to falter, such as increased latency or system failures. Document these findings for future improvements.
Resource Planning
Scaling your SaaS application to meet growing demand requires careful resource management. Focus on these areas:
- Growth projections: Use historical data, user acquisition trends, and seasonal patterns to predict future needs.
- Capacity planning: Calculate the resources required to support growth, adding a safety margin. Tools like New Relic Capacity Planner, AWS Capacity Advisor, and Google Cloud’s capacity planning solutions can help fine-tune these estimates.
Use these insights to guide ongoing monitoring and ensure your application scales effectively.
SaaS Boilerplate Solutions
Pre-built SaaS boilerplates can save you time and effort by offering ready-to-use frameworks that simplify development and support scalable architectures.
Best SaaS Boilerplates
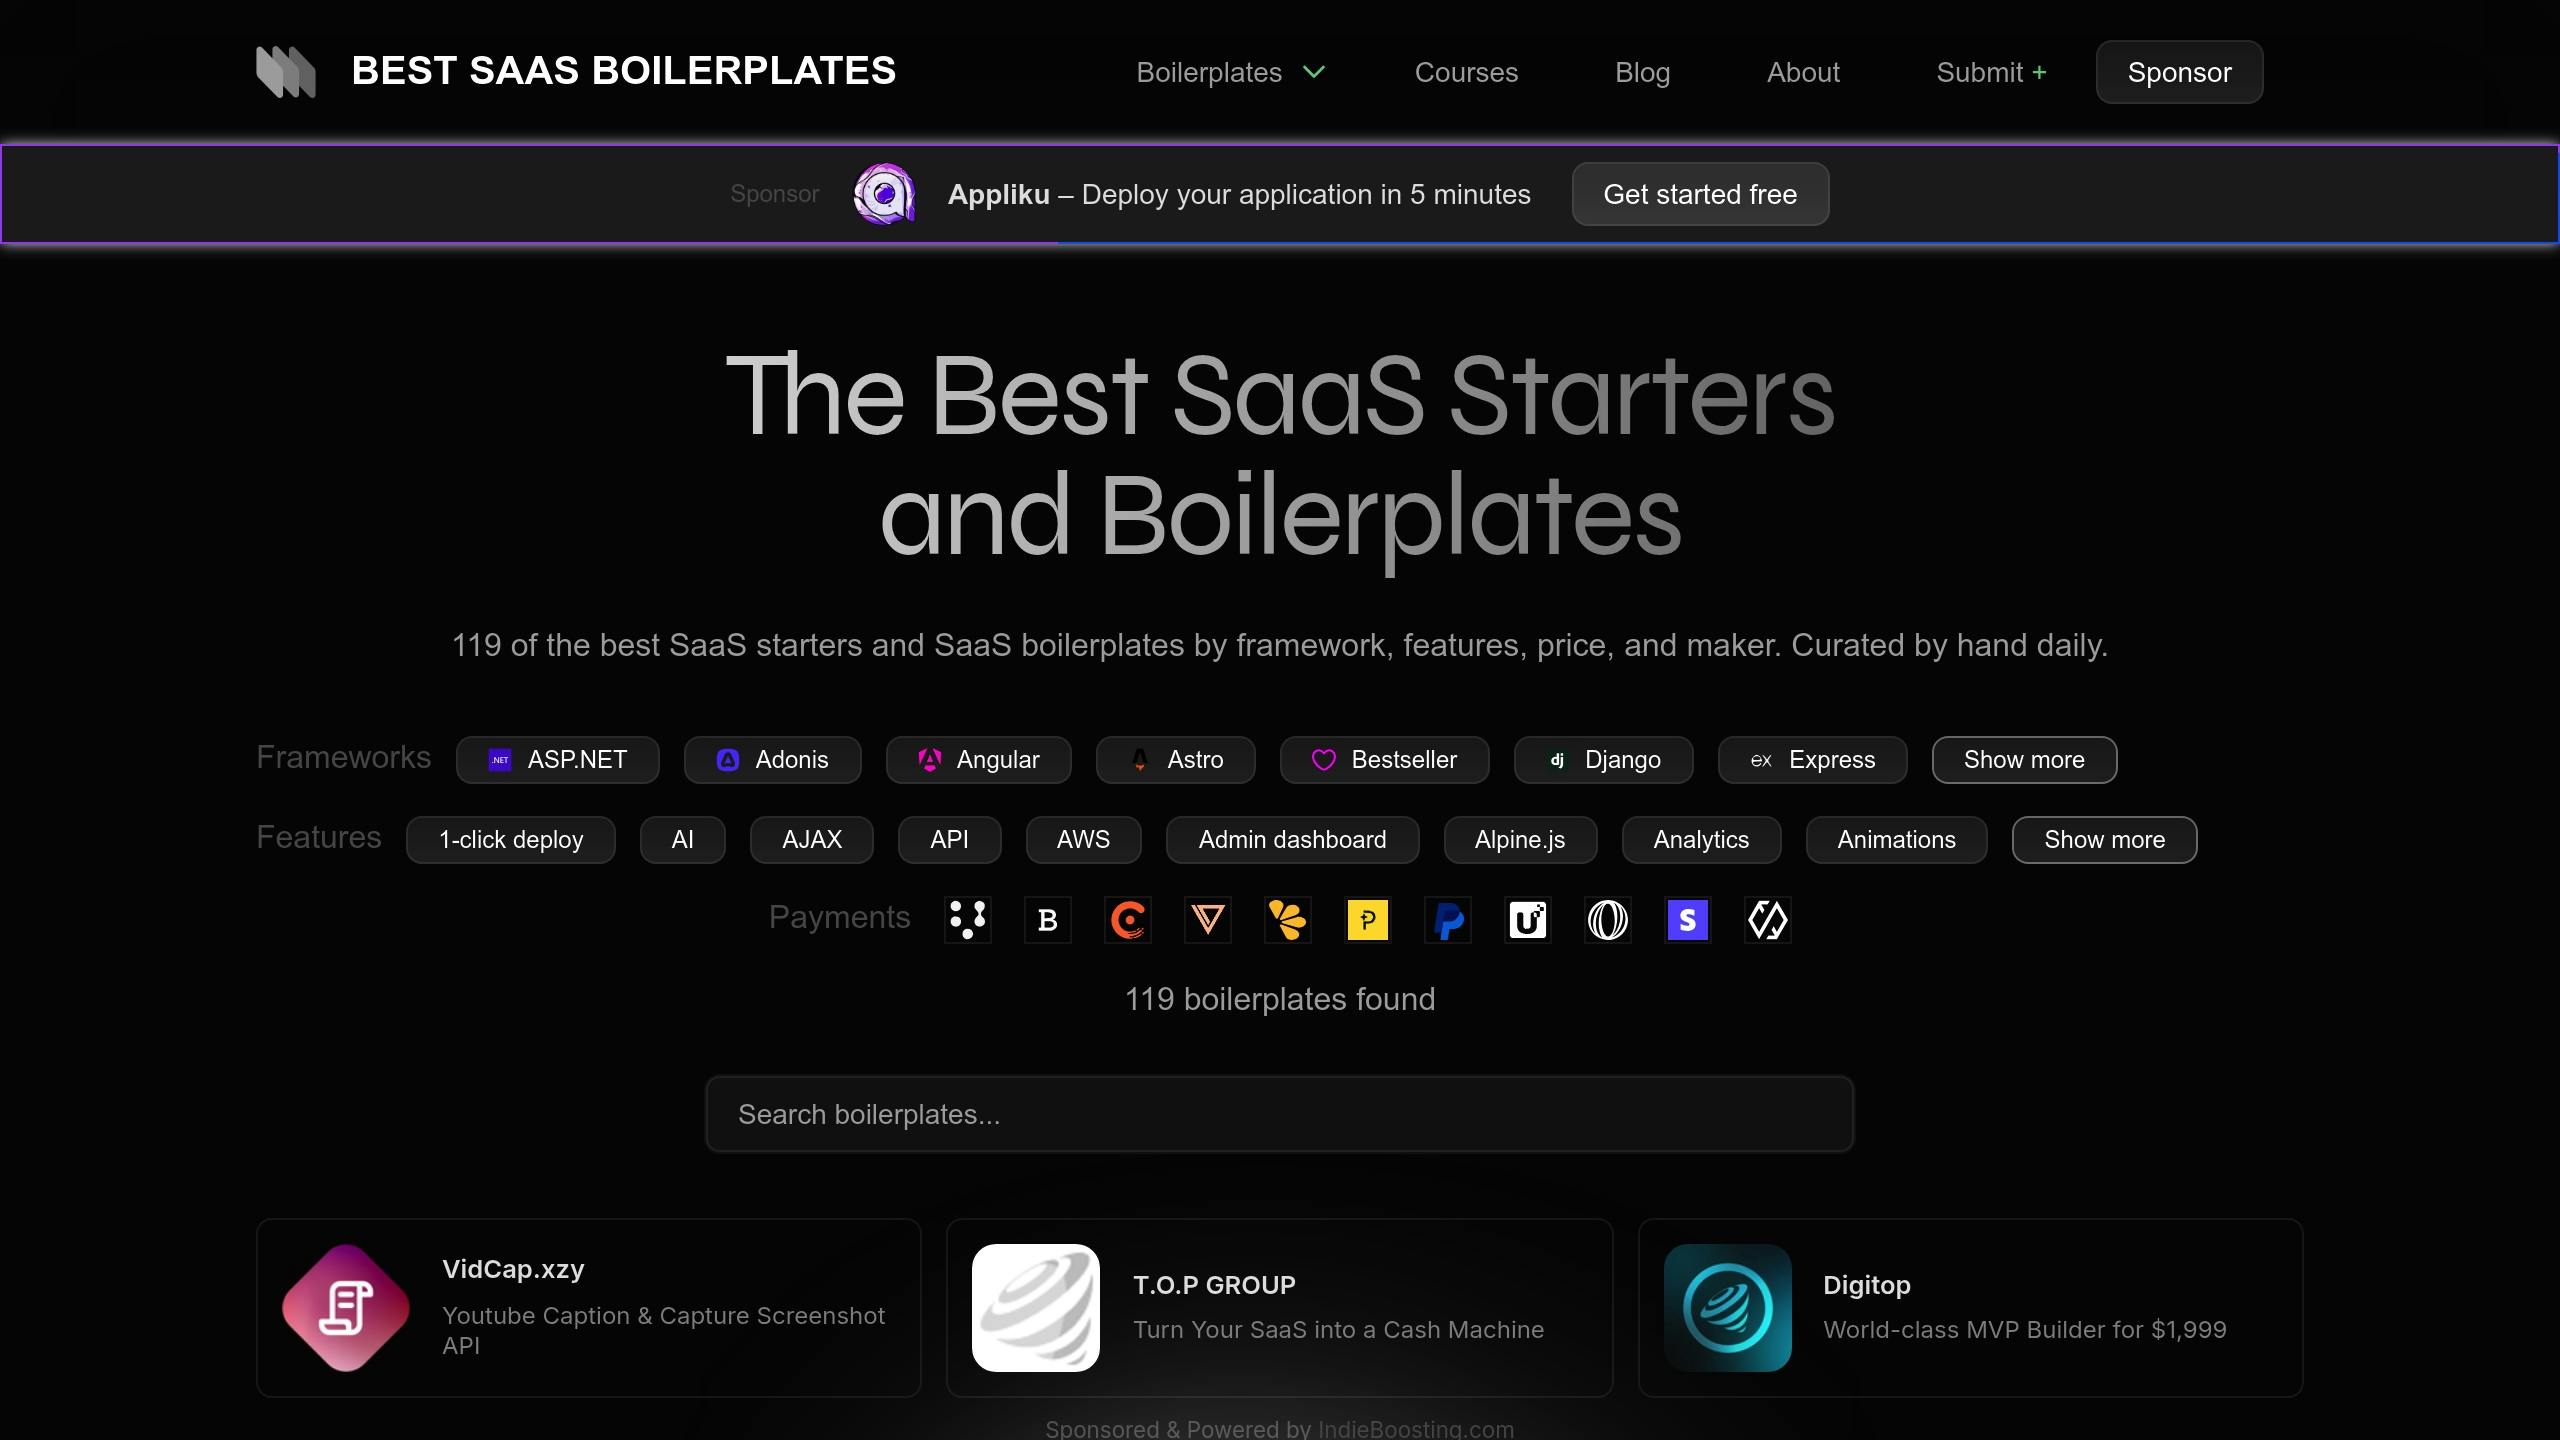
Here are some well-regarded boilerplates known for their scalability and performance features:
| Boilerplate | Key Features | Price |
|---|---|---|
| Makerkit | Multi-tenancy, AI integration, Turborepo | From $299 |
| Shipped | Authentication, payments, i18n support | $299 |
| Scale to Zero AWS | Serverless architecture, CI/CD | From $108 |
| SaasRock | 25+ pre-built features, Stripe integration | From $149 |
For example, Scale to Zero AWS focuses on serverless solutions to handle variable workloads efficiently. As Javid explains:
Build cost-efficient, scalable, and production-ready applications. Eliminate infrastructure complexities and unlock the full potential of AWS serverless development.
These tools can simplify infrastructure management, letting you focus on optimizing your app’s core performance.
Boilerplate Advantages
Using a pre-built boilerplate comes with several benefits:
Built-In Performance Tools
- Scalable authentication systems
- Optimized database operations
- Caching and multi-tenancy features
Time-Saving Development
Jonathan Wilke from Supastarter highlights this advantage:
The ultimate Next.js / Nuxt / SvelteKit starter kit for scalable and production-ready SaaS apps. Save endless hours of development time and focus on what’s important for your customers. Get everything you need to launch your SaaS like auth, payments, i18n, mails and more.
Streamlined Infrastructure
Boilerplates often include tools to address common scalability challenges:
- CDN integration
- Database tuning solutions
- Automated scaling features
- Built-in performance monitoring
When choosing a boilerplate, look for one that matches your technical needs and includes essential features like authentication, billing, and multi-tenancy. This allows you to focus on building your product while relying on proven frameworks to handle growth.
Summary
Tackling SaaS scalability challenges involves using a combination of monitoring tools, thorough testing, and a strong infrastructure. Keeping an eye on performance metrics helps pinpoint bottlenecks early, while structured testing ensures your application can handle increased demand. Below are some key metrics and actionable steps to help identify and address these issues effectively.
Key Metrics and Actions
| Aspect | Key Indicators | Action Items |
|---|---|---|
| Performance | Response times, error rates | Set up alerts for threshold breaches |
| Resources | CPU, memory usage | Track resource consumption patterns |
| Database | Query times, connection pools | Optimize database operations |
In addition to monitoring and testing, using pre-built SaaS boilerplates can simplify scalability. These boilerplates come with ready-to-use frameworks and infrastructure, making it easier to build applications that can grow seamlessly. As Giancarlo Buomprisco from Makerkit puts it:
A SaaS boilerplate where you can choose your favourite tech stack combos - Next.js, Remix, Firebase, Supabase - to build unlimited SaaS products in record time. So good it feels like cheating!
To maintain scalability, teams should prioritize ongoing monitoring, regular testing, and tools that streamline development. This approach allows developers to focus on core business goals while ensuring their SaaS platform performs well under growing demands.
Recommended SaaS Boilerplates
The following SaaS boilerplates come highly commended for their scalability and performance features:

